
Contents
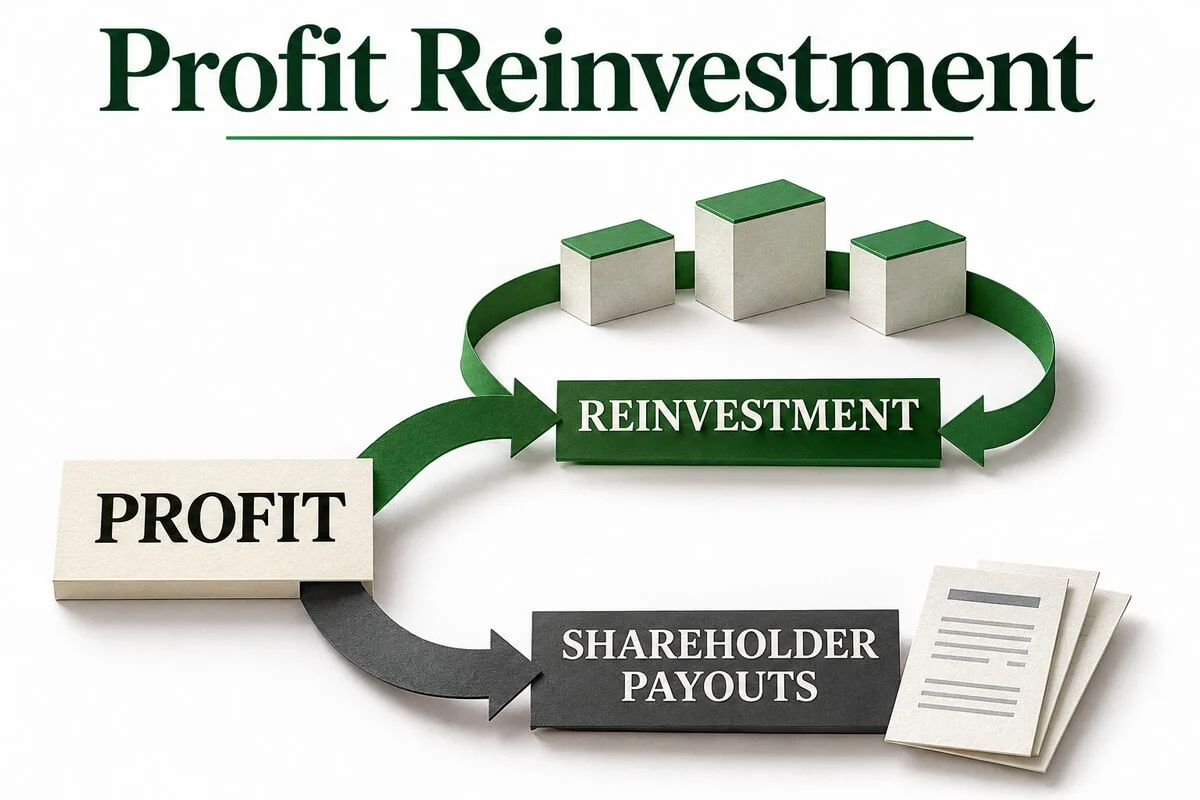
A company can report rising earnings, open new locations and keep nearly all of its profit without creating an attractive outcome for shareholders. Retaining money is a financing decision. Creating value depends on what management does with that money, the cash the investment eventually produces and the risks taken along the way.
Profit reinvestment deserves the same scrutiny as buying a business. An investor should ask what is being purchased, how much capital is really required, when the benefits should arrive and what would make the project a mistake. A larger budget, a larger addressable market and a higher revenue forecast are not answers to those questions.
This guide examines corporate reinvestment rather than dividend reinvestment in a personal brokerage account. The focus is on nonfinancial businesses investing in operations, products, working capital and acquisitions. Banks and insurers require a different framework because their financial assets, liabilities and regulatory capital are part of the operating model.
All numerical examples are hypothetical and use U.S. dollars for convenience. They are not forecasts for named stocks, promised investment returns or personalized investment advice. Accounting treatment depends on the reporting framework and the transaction. Analytical estimates should remain clearly separate from figures reported by the company.
What profit reinvestment actually means
In ordinary investment language, a business reinvests when it commits resources to its future earning capacity instead of distributing all available cash to shareholders. That may involve new equipment, store openings, software, research, customer acquisition, inventory or another business. Some commitments expand the company; others merely preserve its ability to compete.
The phrase does not mean that every payment comes directly from this year's accounting profit. Money is fungible, and expansion can be funded with operating cash, accumulated liquidity, debt or newly issued shares. A company can invest heavily while reporting a loss, or retain substantial earnings while making few new operating investments.
Retained earnings on the balance sheet are not a separate cash reserve. They are a cumulative accounting component of equity. The resources associated with past earnings may already be tied up in property, receivables, inventories or other assets. A large retained earnings balance therefore does not establish how much cash can be spent tomorrow.
The practical starting point is to separate earnings, cash generation, financing and investment commitments. Those four views explain whether expansion is self-funded, whether it depends on outside capital and whether management has room to absorb a disappointing launch without placing the rest of the business under pressure.
The terms to define before calculating anything
NOPAT means net operating profit after tax: an analytical estimate of after-tax operating earnings before financing results. ROIC means return on invested capital. WACC means weighted average cost of capital. Capex refers to capital expenditure, while FCF is free cash flow and FCFF is free cash flow to the firm, before distribution among debt and equity providers.
These labels do not guarantee identical calculations. Companies and analysts may adjust leases, goodwill, cash taxes, development costs and unusual items differently. Incremental ROIC and ROIIC are especially sensitive to the chosen profit measure, investment base and measurement period. Record the definition before comparing the number with a competitor's figure.
Keep reported and adjusted numbers side by side. If an analyst changes the treatment of an expense, the associated capital and subsequent amortization may also need adjustment. Improving the numerator without recognizing the resources needed to produce it is not a neutral restatement.
For the basic distinction between operating returns and capital costs, see InvestLB's guide to ROIC versus WACC and shareholder value creation. Here the more specific question is whether the next investment can earn a worthwhile return, not simply whether the existing asset base had a good year.
Retaining earnings is not the same as reinvesting them
A retention ratio is commonly described as one minus dividends divided by net income. Under that definition, it measures the share of accounting earnings not distributed as dividends. It does not reveal whether the corresponding resources went into operating assets, debt repayment, cash reserves or repurchases.
A company that pays no dividend may still have very little productive reinvestment. Conversely, a business paying a large dividend may fund substantial projects from depreciation-related operating cash generation, existing liquidity or borrowing. Neither payout policy answers the investment question without a cash-flow bridge.
In one common operating valuation framework, net reinvestment includes capital expenditure less depreciation and amortization, together with the increase in noncash operating working capital. Acquisitions and analytical adjustments for intangible investment require additional care. This is an analytical construction, not a universally reported financial statement line.
Build a sources-and-uses schedule instead of inferring investment from the dividend. Start with operating cash, identify capital payments and acquisitions, record distributions and financing, then reconcile the change in cash. The exercise makes hidden dependencies visible: for example, a dividend funded with new debt while expansion absorbs all operating cash.
Find the evidence in filings, not only in presentations
For a U.S. public company, the annual Form 10-K and quarterly Form 10-Q provide a starting point. Read the financial statements, notes, business description, risk factors and management's discussion and analysis together. A foreign issuer may use different annual and interim reporting forms. The relevant reporting framework must be established before making adjustments.
The SEC's investor guide to reading a 10-K and 10-Q explains the role of these filings. A presentation can clarify management's priorities, but selected charts and adjusted metrics do not replace the underlying disclosures and reconciliations.
Collect the cash-flow statement, property and intangible asset notes, acquisition disclosures, lease information, segment results and debt maturities. Also identify commitments for projects not yet paid for. A low current cash outflow can coexist with significant future contractual payments.
Track several versions of the plan. Write down the original budget and delivery date, subsequent revisions, actual spending and commercial results. Without this history, a project that repeatedly misses expectations can look successful merely because each new presentation silently replaces the old target.
Maintenance capex versus growth capex
Maintenance investment preserves the business's existing earning capability. It can include replacing worn assets, renewing essential systems, meeting safety requirements or maintaining service quality. Growth investment seeks additional capacity, customers, products or territories. The distinction is economically useful, but it is not always observable as a clean split.
A replacement machine might reduce costs while adding capacity. A software upgrade might introduce new features while being essential to retain customers. Management's description of an expense as transformational does not establish how much of it is genuinely optional expansion rather than the cost of remaining competitive.
Do not automatically equate maintenance capex with depreciation. Depreciation reflects historical asset costs and accounting estimates of useful lives and residual values. Replacement spending occurs at current prices and may require different technology. Inflation, aging assets and changes in standards can make the gap material.
If the company does not disclose a reliable split, present a reasoned range. Use asset condition, replacement cycles, operating reliability, service standards and contractual requirements. An uncertain maintenance estimate should not become a precise claim about cash that is supposedly available for distribution.
Why a large investment budget proves very little
Capex measures expenditure, not success. A business may invest more because demand is attractive, but also because replacement costs have risen, regulation requires upgrades or an earlier design failed. A growing budget can represent a stronger opportunity or a more expensive route to the same result.
Connect spending to an observable deliverable. That could be usable capacity, distribution coverage, a product milestone, customer service performance or unit cost reduction. If the budget rises without a corresponding change in expected benefit, the economics need to be reassessed rather than praised for their ambition.
Compare definitions as carefully as amounts. A presentation may describe asset additions as capex while the cash-flow statement shows cash payments. Finance leases, capitalized interest, grants and unpaid supplier balances can explain differences. A larger capital asset balance does not always mean an equally large current cash payment.
Capex as a share of revenue can identify a change in capital intensity, but there is no universal ideal ratio. A retailer, a network operator and a software provider use resources differently. The relevant comparison is the complete economic investment needed for a sustainable result, not which company reports the smallest capex percentage.
Working capital is an investment in growth too
Expansion often requires cash before it produces cash. A company may buy inventory, pay suppliers in advance or allow customers time to settle invoices. Supplier credit and customer prepayments can offset part of the requirement. The net effect belongs in the investment analysis even when no new building is involved.
Assume annual revenue of $1 billion rises by $200 million. If the hypothetical business needs additional noncash operating working capital equal to 15% of the incremental sales, another $30 million becomes tied up in the operating cycle. Ignoring that amount understates the resources required to support expansion.
Look beyond the aggregate ratio. Receivables can increase because sales grew or because collections slowed. Inventory can rise ahead of a launch or because customers are buying less than expected. Longer supplier payment terms may improve near-term cash while creating costs, dependencies or future repayment pressure.
Negative working capital can be a genuine advantage when customers pay before the business pays its suppliers. But a slowdown in new orders may reduce incoming advances while old delivery obligations remain. A model that assumes permanently accelerating customer financing can miss the cash consequences of slower growth.
Intangible investment and the accounting framework
A business can invest economically without recognizing a new tangible asset. Product research, software development, training and customer relationships may support future earnings. Their economic purpose and their accounting treatment are separate questions. Spending for the future does not automatically qualify for capitalization or guarantee a positive return.
Under IAS 38 Intangible Assets, research expenditure is expensed and development expenditure is capitalized only when the specified recognition requirements are met. Do not transfer that statement mechanically to every U.S. GAAP expenditure category; software and other arrangements may involve different applicable guidance.
For comparable analysis, an investor may create an adjusted investment schedule for some expensed development spending. Any such model needs consistent treatment of operating profit, invested capital and the subsequent consumption of the analytical asset. Adding every research dollar back to profit while leaving invested capital unchanged can exaggerate returns.
Seek commercial evidence rather than relying on budget size. Product adoption, retention, delivery quality, contract economics and customer acquisition payback can help connect spending with results. Cutting development can temporarily raise reported profit while weakening the future product, just as increasing development can consume cash without producing a viable product.
Incremental ROIC asks what the next dollar earns
Historical ROIC describes the return on a defined existing capital base. Incremental return analysis focuses on the additional operating earnings associated with additional investment. In a simplified calculation, an analyst compares a change in normalized NOPAT with the capital added to generate it.
Suppose comparable after-tax operating profit rises by $24 million following $200 million of additional operating investment. The simple ratio is 12%. It becomes meaningful only if the profit and investment are economically connected, measured on consistent terms and aligned with the time needed for the project to operate.
A favorable commodity price, a tax adjustment or an acquisition can raise earnings without demonstrating a 12% return on the organic project under review. Equally, investment made late in the year may not have had time to contribute. The arithmetic cannot establish causality by itself.
Incremental ROIC and ROIIC are not standardized accounting measures with one definition across issuers. Write down whether the denominator is cash investment, a change in net operating assets or another constructed base. Specify the period, acquisition treatment and any lease or intangible adjustments. Without that information, two apparently comparable percentages may answer different questions.
Do not confuse changes in book capital with cash invested
The difference between two balance-sheet capital figures can reflect depreciation, impairments, foreign-exchange translation, disposals, acquisitions and reclassifications. It is not necessarily the cash paid for new operating resources during the interval. A small or negative denominator may produce an impressive ratio for the wrong reason.
Construct a capital bridge when the changes are material. Begin with opening operating capital, add relevant investments and acquired assets, then identify consumption, disposals, currency effects and other adjustments. Keep the cash-flow bridge beside it so that changes in reported balances are not mistaken for current payments.
A goodwill impairment, for example, may reduce a reported capital denominator and improve a future return ratio without reversing the original purchase price. For judging management's acquisition record, retain visibility into the resources shareholders actually committed as well as the remaining accounting carrying amount.
If reconstruction is impossible, acknowledge the limit. A multi-year incremental ratio can still be a useful diagnostic, but it should not be marketed as a precise project return. Sometimes the strongest conclusion available is that the public disclosure does not allow a reliable attribution of growth to investment.
Match spending with the right generation of projects
Investment and earnings rarely arrive at the same time. A company may design a product, commit capital, complete construction, launch operations and then build utilization over several years. Dividing this year's profit growth by this year's capex can compare mature old investments with new assets that are not yet operating.
Where possible, analyze cohorts of store openings, customer vintages, production capacity or product launches. Separate the initial ramp from mature operating performance. The relevant lag depends on the business; demanding a full return from every payment in the same quarter would be as misleading as ignoring delays forever.
Require milestones that can be checked before the final financial return appears. Examples include commissioning, permits, signed orders, delivery reliability and a narrowing launch loss. When those milestones repeatedly move while the budget expands, revise the investment case instead of extending the deadline without consequences.
For a business with limited project disclosure, use a longer observation window and explain the approximation. A cumulative view can reduce annual timing noise, but it can also hide recent deterioration. Keep each year's spending and operating result visible rather than presenting only a reassuring five-year average.
Growth in earnings is not necessarily growth in value
A project can add accounting profit and still fail to compensate providers of capital for the resources and risk involved. A return-versus-capital-cost comparison is a useful first screen. A full project decision requires the expected cash-flow schedule, asset life, follow-on costs and uncertainty.
The following is deliberately simplified. Each project has a $100 million capital base and a steady annual NOPAT once operating normally. Assume a 12% annual capital charge on that base. The table illustrates annual economic profit; it does not calculate net present value or model asset replacement and changes over the project life.
Hypothetical project | Capital committed | Annual NOPAT | Return on capital | NOPAT less 12% capital charge |
|---|---|---|---|---|
A | $100 million | $18 million | 18% | +$6 million |
B | $100 million | $12 million | 12% | $0 |
C | $100 million | $8 million | 8% | -$4 million |
All three add positive operating earnings under these assumptions. Only A earns more than the specified annual capital charge. This explains why an announcement that a project will be profitable is incomplete: the investor still needs the required capital, the timing of that profit and the appropriate risk benchmark.
The correct hurdle is not automatically the same for every activity within a group. A speculative new market can have different business and financing risks from a mature contracted operation. Using one corporate average rate without examining the project can obscure that difference.
The reinvestment rate and growth relationship
In a stable operating model, expected growth can be linked to the proportion of operating profit reinvested and the return earned on that investment. Aswath Damodaran's discussion of the fundamental determinants of growth develops this relationship. Its value is consistency between resources and results, not a promise that realized growth will match a formula.
Assume normalized annual NOPAT of $100 million, net reinvestment of $40 million and a 15% annual return on the new investment. If the new capital earns that return over the modeled period and the existing business remains unchanged, the additional NOPAT is $6 million. The reinvestment rate is 40%, and the resulting profit growth is 6%.
At the same assumed return, a 12% growth target would require $80 million of net investment in this simplified setup. More growth consumes more resources before it delivers more operating earnings. A forecast that doubles growth without any additional investment needs another explicit explanation, such as spare capacity or better performance from existing assets.
The shortcut is unreliable when earnings are negative, margins are unstable, major acquisitions change the business or investment returns vary sharply. In those situations, forecast volumes, prices, operating costs, investment and working capital separately. A transparent operating model is preferable to a tidy percentage whose assumptions do not fit the business.
Two businesses with the same profit and different reinvestment quality
Consider two hypothetical companies, each earning $100 million of normalized NOPAT and making $50 million of net operating reinvestment. Ignore financing changes and assume that the existing operations maintain their prior earnings. The new projects are evaluated after reaching the steady operating condition specified in the example.
Company A earns 20% on the additional investment; Company B earns 8%. The resulting additional NOPAT is $10 million and $4 million, respectively. Both used the same amount of current resources, but they created different operating earnings potential.
Hypothetical measure | Company A | Company B |
|---|---|---|
Starting NOPAT | $100 million | $100 million |
Net reinvestment | $50 million | $50 million |
Return on the new capital | 20% | 8% |
Additional annual NOPAT | $10 million | $4 million |
NOPAT after the modeled contribution | $110 million | $104 million |
Starting-period FCFF: $100m less $50m | $50 million | $50 million |
With a hypothetical 12% annual capital charge, the additional $50 million creates $4 million of annual economic profit for A and negative $2 million for B. These are operating illustrations, not shareholder stock returns. They do not incorporate the purchase price of the shares, financing effects or a complete discounted cash-flow analysis.
The example shows why identical retention rates and current free cash flow do not establish equal investment quality. It also explains why A's shares are not automatically the better purchase. The market might already price in decades of unusually attractive projects while leaving little room for execution problems.
Separate investment returns from improvements in existing operations
Profit can grow through better utilization, pricing, product mix, lower waste or more efficient scheduling, not only through new capital. If these effects are assigned entirely to recent investment, the apparent incremental return can become unrealistically high.
A business moving from 60% to 80% utilization may earn considerably more from assets that were funded earlier. Dividing the full increase in profit by a modest current investment budget would attribute the recovery to the wrong spending period. The improvement may be valuable without proving that the next expansion earns the same return.
Pricing requires a similar bridge. Higher nominal sales can coexist with higher wages, materials and replacement costs. A reported increase in revenue does not necessarily mean stronger real volume or more cash available for new projects. Check quantity, mix, unit cost and the capital required to maintain the operation at current prices.
Create an operating profit bridge with separate explanations for existing assets, new projects, acquisitions and external conditions. Perfect precision may be unavailable, but identifying the major drivers is enough to avoid presenting favorable market conditions as evidence of exceptional capital allocation.
Test earnings quality before trusting the growth calculation
A reinvestment model begins with the operating earnings believed to be sustainable. If that starting number includes unusual gains, aggressive adjustments or weak cash collection, the growth calculation can be misleading before the investment assumptions are even considered.
Reconcile earnings with operating cash flow and inspect receivables, inventories, customer advances and capitalized costs. A receivable increase may be normal expansion, but deteriorating collection and repeated deadline extensions require a different explanation. An asset sale can improve liquidity without creating a recurring operating cash source.
Read InvestLB's guide to quality of earnings, cash conversion and accounting red flags for that separate review. For reinvestment analysis, the important discipline is to establish a defensible earnings base before assigning an attractive percentage return to new projects.
Keep accounting compliance and investment attractiveness distinct. A correctly reported capitalized asset can still fail commercially. An expensed development project can still generate future value. The investor needs the economic evidence and the accounting reconciliation, not an automatic judgment based on which statement contains the cost.
Acquisitions: do not remove the purchase price from the return calculation
Acquisitions can accelerate growth but can also make reinvestment analysis deceptive. Consolidated earnings may rise because a new business was purchased, while an organic capex figure excludes the purchase consideration. Dividing the entire profit increase by organic investment produces a mismatched ratio.
Examine cash consideration, shares issued, debt assumed, contingent payments and integration requirements. A deal's economic cost can differ from its headline cash price. Avoid double counting components, but do not omit a component simply because it appears outside the investing cash line selected for the spreadsheet.
Separate growth in the original business from the acquired contribution. Compare promised synergies with actual cost savings, revenue retention and cash conversion. Synergy is an expectation until comparable operating results support it; repeating the target in an earnings release does not make it realized.
Preserve acquisition history after impairments. An accounting write-down may reflect a changed outlook and reduce reported net assets, but it does not refund the original owners' investment. Management's allocation record should not improve merely because the carrying value of an unsuccessful acquisition was reduced.
Reinvestment runway: how much attractive opportunity is really left?
A business can have high current returns and limited room to expand. Its best locations may already be open, its most receptive customers already served and its existing niche largely occupied. The relevant runway is the opportunity to invest additional capital at acceptable expected returns, not the broad size of an industry slide.
Distinguish total market demand from demand the company can economically serve. Licensing, distribution, language, logistics, price positioning and customer switching behavior may constrain expansion. Entering a new geography can change the cost base and the competitive proposition rather than replicate the original business.
Compare later investment cohorts with earlier ones. Are new stores reaching maturity as quickly? Does a later customer group cost more to acquire? Does retention remain comparable? If new opportunities are systematically weaker, assuming the historical average return forever overstates the runway.
A disciplined mature business can be a better allocator than an ambitious company that chases marginal projects. Refusing weak expansion and returning excess capital is not a failure to innovate. It can be recognition that the next available use of money is less attractive than the alternatives.
Payback, IRR and NPV answer different questions
A simple payback period asks when cumulative cash receipts recover the initial cash outlay. It can help assess how long capital is exposed before recovery. But the undiscounted version ignores the time value of money and does not value cash generated after the payback point.
Net present value discounts the project's expected cash flows at a specified rate and compares them with the required investment. Internal rate of return is a rate at which the modeled NPV equals zero. These tools are useful only when the cash-flow schedule is credible and the relevant risks and costs have been included.
For a hypothetical $100 million outlay today and five year-end project cash inflows of $30 million, NPV at 12% is about positive $8.14 million. If each inflow is $25 million instead, NPV is about negative $9.88 million. There is no residual value or further cash expenditure in this example; the stated inflows are fully available project cash flows.
A high percentage IRR on a tiny project does not necessarily create more absolute value than a lower IRR on a much larger project. Differences in duration and reinvestment opportunity matter. For unconventional cash-flow patterns with several sign changes, IRR can also have interpretation problems, including multiple mathematical solutions.
Why free cash flow can fall during worthwhile expansion
New investment often reduces current free cash flow. That is the price of an expected future benefit, not evidence that the benefit will arrive. A low or negative FCF figure should be explained through project timing, economics and funding rather than treated automatically as either a warning or a badge of ambition.
In a consistently defined operating model, FCFF can be represented as NOPAT less net reinvestment. This cash flow is before distribution among capital providers. It is not automatically a safe dividend budget, because debt service, financing structure, liquidity and contractual constraints still matter to shareholders.
Do not deduct working capital twice. When beginning with reported operating cash flow, relevant operating working-capital movements are generally already embedded in the statement reconciliation. Review the actual classification before applying adjustments. CFO less capex and FCFF are not interchangeable labels without a bridge.
Follow the full cash cycle of the project. A single investment year can look weak even when later cash generation is attractive. On the other hand, repeatedly promising free cash flow next year while discovering new essential investment needs may indicate that the underlying business consumes more resources than the original case assumed.
Debt and liquidity determine whether the company can wait
An attractive long-term project can create a near-term liquidity problem. Compare scheduled investment payments, unrestricted cash, operating cash needs, debt maturities and covenant limits. A five-year profit forecast cannot pay an invoice due next month.
Stress delays and weaker demand together rather than one variable at a time. A late launch can increase costs, postpone receipts and reduce borrowing flexibility simultaneously. Do not assume lenders will always extend credit or that shareholders will provide new equity at a favorable price.
Funding should be assessed against the duration and risk of the investment. Short-term borrowing for a long project creates refinancing exposure. Debt in a currency different from project cash receipts adds another dependency unless there is an effective economic or contractual offset.
InvestLB's guide to corporate debt, interest coverage and refinancing risk provides the broader framework. For reinvestment, the central question is whether the business can reach the expected payoff without being forced into a destructive refinancing, asset sale or emergency equity issue.
Dividends, repurchases and debt reduction are genuine alternatives
Management should compare new projects with other uses of capital. Those include reducing risky debt, maintaining an appropriate liquidity buffer, distributing dividends and repurchasing shares. There is no general rule that keeping money inside the company is always superior to returning it.
Foregoing a dividend can make sense when attractive projects are available. It does not make sense merely because management prefers a larger organization. Equally, a large payout does not establish discipline if it is funded by inadequate maintenance or borrowing that the business cannot comfortably service.
Repurchases require an assessment of price and share count. Spending on buybacks can be substantial while net shares barely decline because new compensation awards or acquisitions issue more shares. The separate guide to stock buybacks, EPS and dilution explains that distinction.
Holding cash can also be reasonable when commitments or uncertainty are substantial. But a growing cash balance without a clear purpose deserves questions about accessibility, required reserves and capital policy. Cash accumulation alone is not a substitute for deciding how owners' resources should be used.
Management incentives and the discipline to stop
Inspect the incentives behind the investment plan. Compensation linked mainly to revenue or adjusted EBITDA may reward size differently from a system that considers capital efficiency and cash generation. No compensation metric proves behavior by itself, but incentives help frame the questions investors should ask.
Compare original promises with later outcomes. Maintain a project ledger showing the first announced budget, commissioning date, target capacity or commercial result, revisions and actual milestones. Legitimate external changes should be recorded, not used to erase the original investment rationale.
The willingness to stop matters. Money already spent cannot be recovered merely by spending more. A decision to continue should compare future incremental costs and benefits, including credible termination costs, rather than defend historical expenditure because it is uncomfortable to admit a mistake.
Changing definitions of success, excluding every disappointing project from the return record and presenting cost overruns as progress without revised economics are reasons to investigate. They are not automatic proof of misconduct. Distinguish an unsupported claim from an established accounting or legal violation.
Connect reinvestment to the price of the stock
An excellent business can still be a disappointing purchase if the entry price assumes too much. An investor may overestimate how long high-return opportunities last, underestimate competition or assume that growth requires less capital than it actually does. Business quality and investment price remain separate parts of the decision.
In a discounted cash-flow model, operating growth needs an associated resource plan. Sustained fast expansion, negligible capex, no additional working capital and permanently high returns cannot simply be selected as independent favorable assumptions. Temporary spare capacity may explain some growth, but eventually the model needs an economic reason.
Test how much of the valuation depends on years beyond the period with useful operating visibility. Then lower the expected return on new investments, shorten the runway and allow a slower ramp. If a small change eliminates the apparent discount, the investment case depends heavily on forecast precision.
A margin of safety should reflect that uncertainty rather than merely subtract an arbitrary percentage from an optimistic central estimate. The company's stock is not automatically attractive because management has an appealing expansion narrative or because the historical ROIC exceeds a selected hurdle.
Terminal growth cannot be obtained without resources
A long-term forecast should connect growth with reinvestment and sustainable capital returns. Damodaran's discussion of excess returns and terminal value highlights this consistency requirement. A mature business may reinvest less than a fast-growing one, but assuming growth does not justify assuming no associated investment.
In a simplified stable model, 3% growth in NOPAT with a 12% return on new capital implies net reinvestment equal to 25% of NOPAT. If the return is 8% instead, the required share becomes 37.5%. Identical profit growth can therefore leave different amounts of free cash flow.
These are model relationships, not precise operating instructions. Currency, nominal versus real growth, inflation, replacement requirements and the treatment of intangible resources must remain consistent. A formula with incompatible inputs can look exact while producing a misleading estimate of value.
Be particularly cautious about assuming unusually high returns on all future investments indefinitely. Explain the market opportunity, competitive defense and costs of maintaining the position. A leadership claim in a presentation does not establish that the company can deploy ever more capital on the same attractive terms.
Build scenarios around causes, not arbitrary percentages
Start with a base case, an adverse case and a stronger case. Give each an operational explanation. A base case might involve an on-time launch and normal customer adoption; an adverse case could combine a delayed launch with weaker utilization; a stronger case might require extra working capital to serve unexpectedly high demand.
Change linked assumptions together. Lower sales can affect inventory, unit costs, covenant headroom and the ability to fund the next phase. Higher sales can require supplier advances or another capacity commitment. Altering only profit while leaving every cash requirement unchanged often understates the range of outcomes.
Do not assign exact probabilities simply to make a spreadsheet appear sophisticated. A range and a clear explanation of the conditions under which the thesis fails may be more useful than a probability-weighted average based on unsupported weights.
Define observations that would move the investment into another scenario: revised construction costs, customer renewal, signed contracts, mature unit performance, launch timing or a financing change. Future disclosures should test the original thesis rather than trigger a new story designed to preserve it.
Sector differences make universal rankings unreliable
Banks and insurers require sector-specific analysis of capital, asset quality, liabilities and regulatory requirements. Applying a conventional industrial working-capital and net-debt framework mechanically can misclassify operating resources and produce misleading cash-flow conclusions.
Commodity businesses depend on price cycles, reserve quality and development requirements. Infrastructure businesses depend on utilization, contracts and regulation. Software businesses may expense a significant share of their economic investment. An identical accounting return does not imply an identical opportunity, duration or risk.
Lease treatment also matters. A business renting assets and a business owning them may show different capex and balance-sheet patterns. Align profit, capital and cash-flow definitions before concluding that one model is inherently less resource-intensive.
Begin with comparable businesses and comparable stages of development, then return to the universal questions: how much money is committed, what cash is expected, when it arrives and what can go wrong. The questions travel across sectors more reliably than a single numerical threshold.
A practical reinvestment worksheet
Maintain a consistent multi-year schedule of revenue, operating earnings, normalized NOPAT, operating cash flow, capex, depreciation, working capital, acquisitions and commitments. Record units, currency, period and source for every material figure. Preserve restatements so that different years are not assembled from incompatible disclosure versions.
Use a separate project sheet for purpose, original budget, actual spending, remaining commitments, expected launch, commercial evidence and financing. Do not allocate shared infrastructure precisely across projects unless the disclosure supports that precision. An explicit unallocated line is better than a fabricated project return.
Question | Evidence to record | What it helps prevent |
|---|---|---|
What preserves existing earnings? | Replacement, essential upgrades and service obligations | Calling all maintenance spending growth |
What will actually expand? | Product, capacity, geography or customer cohort | Confusing an ambition with a deliverable |
What is the full resource requirement? | Capex, launch costs, working capital and later payments | Understating the investment |
When should returns appear? | Milestones and ramp-up assumptions | Matching earnings with the wrong spending period |
Can the balance sheet tolerate delay? | Liquidity, maturities and covenant headroom | Ignoring financing risk before payoff |
What is already priced into the shares? | Runway, margins, reinvestment and discount-rate assumptions | Equating a good business with a cheap stock |
Finish with an ordinary-language conclusion. For example: later cohorts are taking longer to mature, the budget has risen and liquidity is adequate only if the next launch arrives on schedule. That conclusion is more actionable than a capital-allocation score of eight out of ten with no reproducible economic meaning.
A worked stress test for an expansion program
Assume a hypothetical project requires $100 million today and produces five year-end available cash inflows. The original plan uses $30 million per year and a 12% discount rate, giving NPV of approximately $8.14 million. All taxes and necessary operating and maintenance payments are already reflected in those inflows, and no residual value is assumed.
Now keep the same $30 million annual cash flow but increase the initial cost to $115 million. NPV falls to approximately negative $6.86 million. The project still produces the same sales story, but more of the future benefit has been spent obtaining it. A cost overrun must therefore be reflected in value, not only mentioned as a scheduling update.
Alternatively, keep the initial cost at $100 million but delay every $30 million inflow by one year, so cash arrives at the end of years two through six. At the same 12% rate, NPV is approximately negative $3.44 million. This isolates a timing effect; an actual delay could also bring extra costs and different demand.
The scenarios are not probability estimates. They demonstrate why implementation and financing matter even when steady-state operating profitability looks attractive. The appropriate follow-up is to identify which parts of the plan are contractually supported, which remain uncertain and how much room the current stock price leaves for disappointment.
Common mistakes that distort the conclusion
Treating retained earnings as a cash account available for expansion.
Assuming every capital payment is discretionary growth investment.
Using depreciation as an exact replacement budget.
Ignoring working capital, start-up losses and future contractual payments.
Attributing favorable prices or better utilization entirely to new investment.
Matching current profit growth with projects that have not started operating.
Including acquired earnings but leaving acquisition consideration out of the denominator.
Assuming the return on old assets guarantees the return on new assets.
Adjusting profit for intangible spending without adjusting capital consistently.
Forecasting permanent growth without the necessary reinvestment.
Calling negative free cash flow proof of a successful investment phase.
Ignoring the share price, dilution and terms of external funding.
The remedy is not another all-purpose ratio. Return to definitions, source documents and the timing of the economic activity. If the disclosures do not support an exact answer, keep the uncertainty visible. A justified range is more useful than a confident decimal built on incompatible figures.
Turn the analysis into a monitoring plan
Before buying a stock, write down which investments are expected to produce additional cash and what supports that expectation. Identify the balance-sheet limits, valuation assumptions and conditions that would invalidate the thesis. Position size should reflect uncertainty rather than the attractiveness of a single upside scenario.
After each important disclosure, update actual spending, remaining commitments, launch timing, operating evidence and funding. A project reaching a milestone is new information. A repeated delay is also new information. Neither should be ignored just because the investor originally intended to hold the shares for many years.
Separate stock-price movements from operating evidence. A falling share price does not prove a project failed, while a rising share price does not validate its economics. Evaluate the business and the price together without allowing either one to substitute for the other.
This article does not recommend a broker or investment product. Access to a trading account is separate from the quality of a capital-allocation decision. Transaction costs, taxes, diversification and personal liquidity needs remain relevant, and their specifics depend on the investor and jurisdiction.
Frequently asked questions about profit reinvestment
Does a company that pays no dividend necessarily grow faster?
No. Resources can accumulate in cash, repay obligations or cover current operating needs. Faster sustainable growth requires attractive opportunities, sufficient funding and successful execution. The absence of a dividend establishes none of those conditions by itself.
Is a higher reinvestment rate always better?
No. More reinvestment at poor expected returns can enlarge a weak business. A lower rate can be sensible when attractive opportunities are limited and capital is returned or debt is reduced. Evaluate the opportunity and the alternative use, not only the percentage retained.
Can public filings reveal the exact return on a new project?
Sometimes detailed disclosure helps, but investors often lack project-level cash flows and reliable allocation of shared costs. Incremental ratios and cohorts provide evidence, not automatic precision. Explain which components are known and which are assumptions.
Why can earnings rise even when reinvestment destroys value?
A project may add positive earnings that are too small relative to the investment and risk. Strong old operations may also conceal weak new activities. Growth in the accounting total does not establish that owners have been adequately compensated for the resources committed.
Does negative free cash flow prove the investment program failed?
No. Large scheduled payments can precede returns. But a credible program still needs milestones, commercial support and financing that survives an adverse scenario. Negative cash flow alone proves neither future success nor failure.
Must a new project exceed WACC in its first reported year?
Not necessarily. Start-up costs and partial utilization can depress early accounting returns. Evaluate the full expected cash-flow life and monitor progress toward operating targets. A legitimate ramp-up period is not a reason to postpone every accountability test indefinitely.
Can an investor use the same reinvestment assumption forever?
Only as a justified modeling assumption, not a universal fact. Markets, competition, capital intensity and returns change. Mature-period growth and reinvestment should remain consistent, and exceptionally high returns need a defensible explanation.
Is a long reinvestment runway enough to justify a high stock price?
No. The duration, economics and risk of the runway may already be overestimated by the market. Compare the current price with several plausible cash-flow outcomes. A valuable business characteristic does not justify paying any price.
How often should the investment thesis be reviewed?
Review it after significant results, budget revisions, acquisitions, financing changes and project milestones. Routine price volatility need not rewrite the thesis, but material evidence that contradicts its assumptions should not be dismissed as short-term noise.
The bottom line: judge the next dollar, not the size of the budget
Good reinvestment combines worthwhile expected project economics, enough attractive opportunity, a realistic implementation schedule and resilient funding. A historical ROIC, a large market and a low payout ratio cannot verify all those conditions on their own.
Reconstruct the cash and capital bridges, separate maintenance from expansion, account for working capital and follow the actual operating evidence. Then connect those findings to what the stock price already assumes. That process distinguishes value-creating growth from expansion pursued mainly for scale.
The essential question is not how much profit management kept inside the business. It is what additional cash owners can reasonably expect for the capital and risk committed, and how much they must pay today for that expectation. An answer with visible uncertainty is more useful than certainty that the available evidence cannot support.
Comments and reviews 0
Reader perspectives and experience.
Leave a comment or review
Messages are moderated and appear after approval and site publication.
Cancel reply


No comments yet. You can start the discussion.