Strategies of binary options trading as in the Forex trade can be based on two different approaches:
- use of multiple indicators, including special author. As soon as you match all the required conditions, you can open a position. The advantage of the approach in the filtering of false alarms (some policies include up to 4 indicators), the downside is you have to wait a long time when you match all the conditions, that is, a small number of inputs in the market;
- the use of forward signals with 1-2 indicators. In futures trading leading as the forward signal, for example, the value of securities with shorter period of treatment is used (5-year bonds vs 30 years). For binary options I propose to consider the analysis of time periods, which together with the already known indicators are able to give fairly accurate signals.
The analysis of time periods
To the strategy of the analysis time frames I laid three indicator (for reliability), because I consider only those tactics, where the risks are minimized. Having the experience, you can also reduce the number of indicators or parameters to change their settings. The analysis of indicators is carried out in 2 time intervals: one interval is formed by the preliminary signal, the second proving, where we open a transaction.

Trading conditions:

- trading intervals: daily and 4 hours (in extreme cases, you can use an hour period);
- trading is performed only in the direction of the main movement;
- any underlying assets.
Used indicators:
- simple moving average. Indicator showing the average value over a fixed period. Price position relative to this indicator says about the direction of the trend. Traders analyze the indicator on the basis of which the direction indicator is deployed. Applies to auxiliary tools;
- MACD. A popular indicator of technical analysis, which is based on moving averages, periods of signal lines and the types of prices;
- EFI (or RSI). The power index, is an additional indicator that smoothes the signals, shows the power of buyers in an uptrend or sellers in a downtrend.
Analyze time periods, beginning with the day, since the position will open on the 4-hour interval.
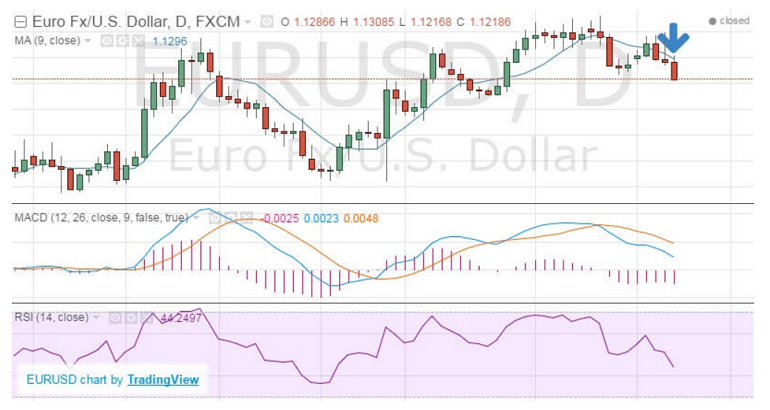
- To receive signal the analysis of the moving average on the daily chart should be performed. If the closing of the daily candle happened above the moving, then 4 hours chart offers the option to purchase. Similarly with the sale, below — sell option. Notice if there is doubt as to whether the close of the candle is above or below relative to the moving, it is better not to enter the market.
![the analysis of daily graphs binary options]()
- Once the condition on the daily chart is done go to a 4 hour schedule. Now the task is to determine the direction of the curve RSI and wait for the moment when the MACD crosses the zero level:
- opening a sell position (Put). Simultaneous fulfillment of conditions: the daily candle closed below the moving average (on daily chart), the 4-hour candle closes below mA and RSI goes down in price trend, the MACD crosses the “0” level from the top down;
- opening a position to buy (Call). Simultaneous fulfillment of conditions: the daily candle closed above the moving average (on daily chart), the 4-hour candle closes above the moving, RSI is going up in price trend, the MACD crosses the level “0” from the bottom up.

The strategy of analysis of time frames is working, but requires care and assiduity. It is advisable to obtain a small but steady income, as well as for developing understanding of complex analysis of indicators on different time periods.


